The concept of data literacy is the ability to read, understand and make decisions based on data. Thanks to this ability, employees of any level can search for the right information in data, make decisions and convey the meaning of the information to others.
Some of the challenges that data literacy implies for companies are:
- Lack of governance
- Lack of employee / manager security
- Employee reluctance
- Lack of a data-driven culture
According to a recent study (by Censuswide) in which more than 7,000 managers participated, only 24% said they felt they had a good level of data literacy, despite 92% said that it is important that employees have data literacy, Only 17% say that their organization is taking significant steps so that staff can use data with greater confidence.
Darell Huff, an American writer and the author of the bestseller “How to Lie with Statistics”, the best-selling statistics book of the second half of the 20th century, describes some of the errors in the interpretation of statistics and in the easiness in altering the meaning of data.
In today’s article we bring you a summary of the best practices to understand data objectively according to the book “How to lie with statistics”:
- Observe the correlations with skepticism
When two variables X and Y are correlated, there are four possible explanations:
A. X causes Y
B. Y causes X
C. A third variable, Z, affects both X and Y
D. X and Y have no relationship
For example, when we hear that having regular physical activity habits is positively correlated with a longer life expectancy, we conclude that the more sport you do leads to a longer life expectancy. However, the results could be influenced by a third factor, such as diet or economic level. This third hidden variable can lead us to incorrect conclusions about causality.
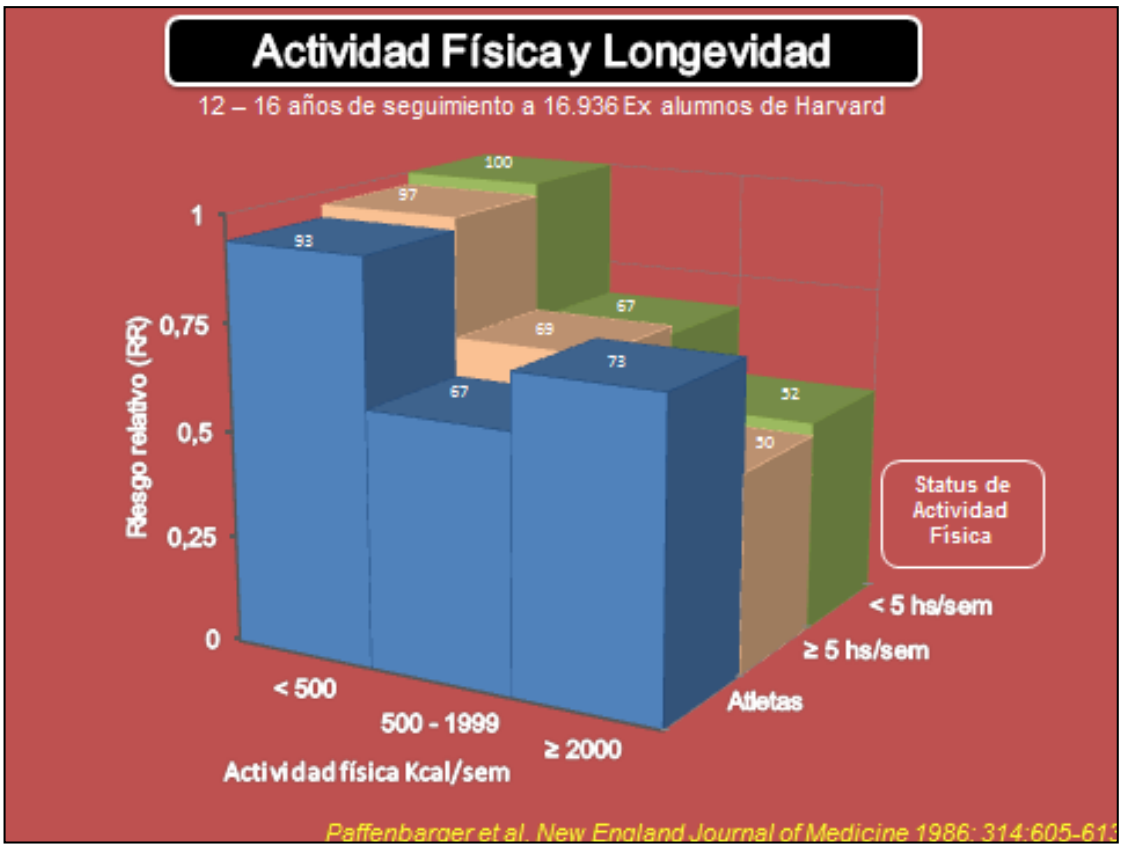
It should be noted that in observational studies there are additional factors that we do not measure, therefore questions about causation can be answered by randomized controlled trials.
Humans like orderly and causal narratives, but the data doesn’t always say the same thing.
- Relationships don’t last forever
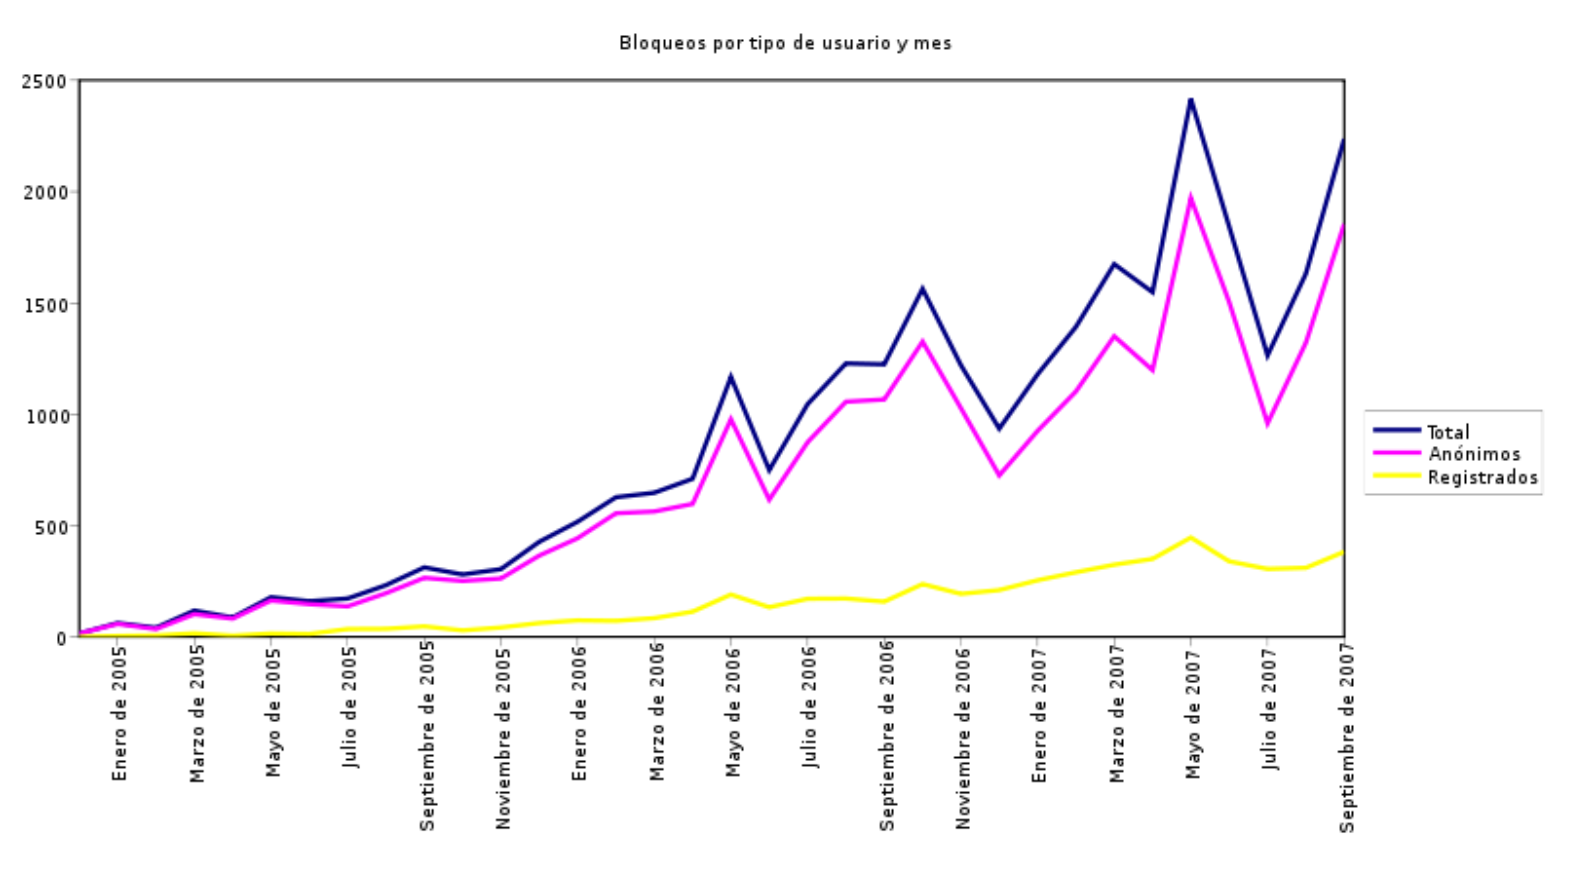
We cannot assume that correlations always follow the same positive or negative direction. Linear relationships are almost always only linear in a limited region of both variables. Beyond a certain point, the relationship can become logarithmic, disappear completely, or even reverse.
This can be observed in growth curves over time, in which, for example, there may be periods of linearity where growth occurs at a constant rate, but eventually, growth stabilizes because almost nothing continues to grow indefinitely.
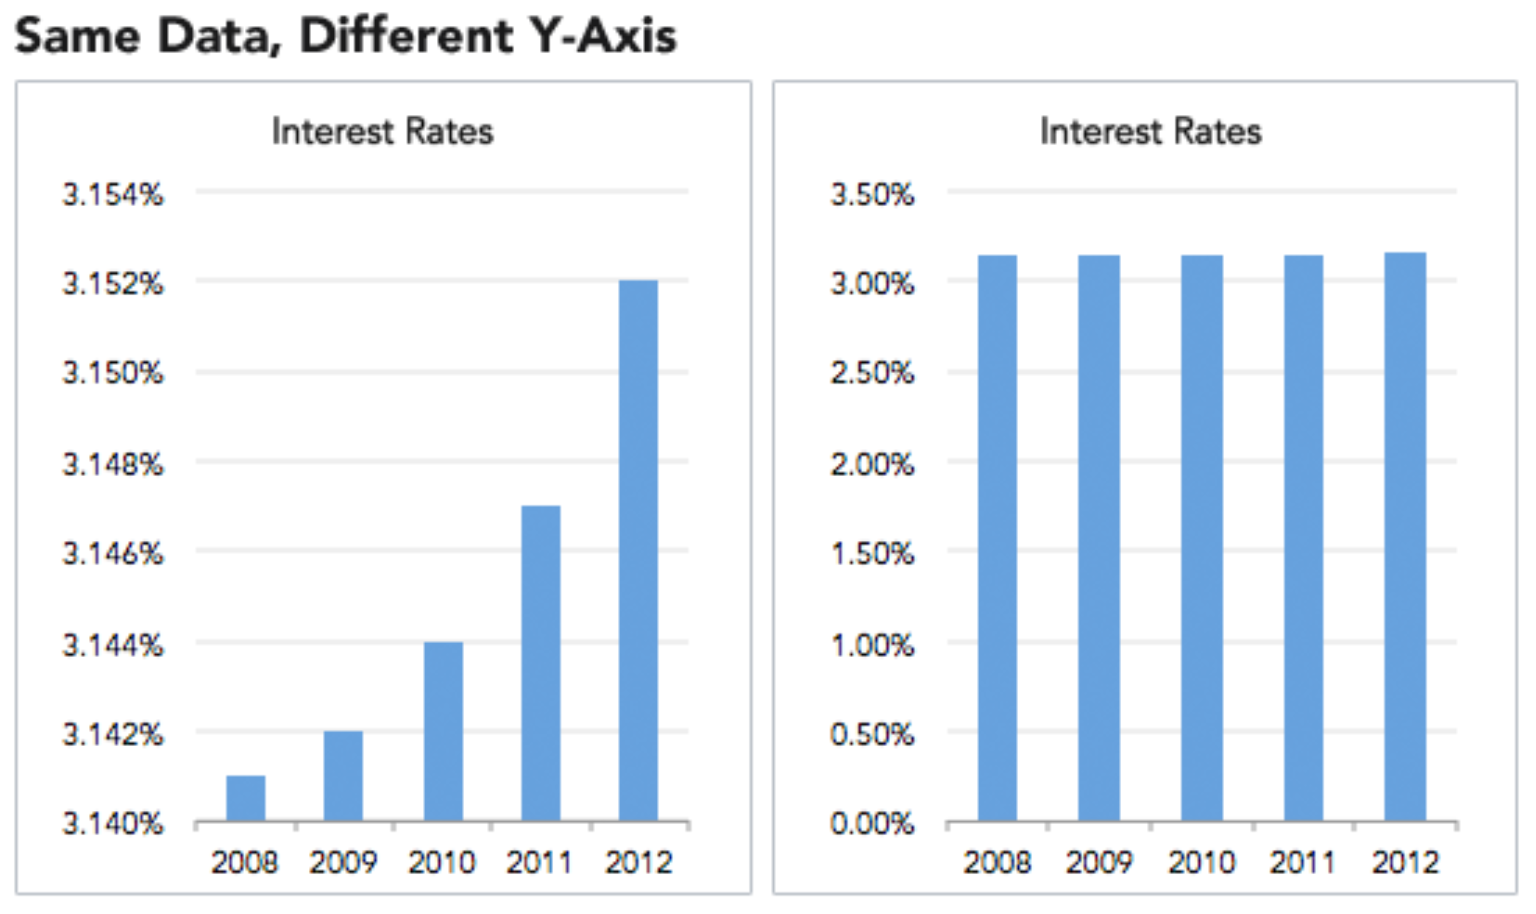
- Always look at the axes on a graph
As a first principle, the y-axis in a bar chart should always start at 0. Otherwise, it is easy to test an argument by manipulating the range, for example by converting minor increases to massive changes.
This is a technique widely used in the media and this happens because people do not read the information. Most people look at a graph and immediately draw a conclusion from the shape of the lines or bars, exactly as the person who made the graph wants.
- Samples too small
When conducting a study, a sample is used, that is, a subset of the population intended to represent the entire population. This works well when the sample is large enough, but often due to limited funding or low response rates, psychological, behavioral, and medical studies are conducted with small samples, leading to questionable and unrepresentative results.
Humans are not very good at adjusting sample size when evaluating a study, which in practice means that we treat the results of a 1000-person trial in the same way as a 10-person trial. This is known as ‘sample size insensitivity‘ or ‘sample size neglect’.
- Checking the average used
The definition of average can vary greatly depending on the terms we use. The options that exist are the following:
Mean: add the values and divide by the number of observations
Median: order the values from least to greatest and find the middle
Mode: find the value that occurs most frequently
For example, the median and median median income in the United States differ by approximately $ 16,000.
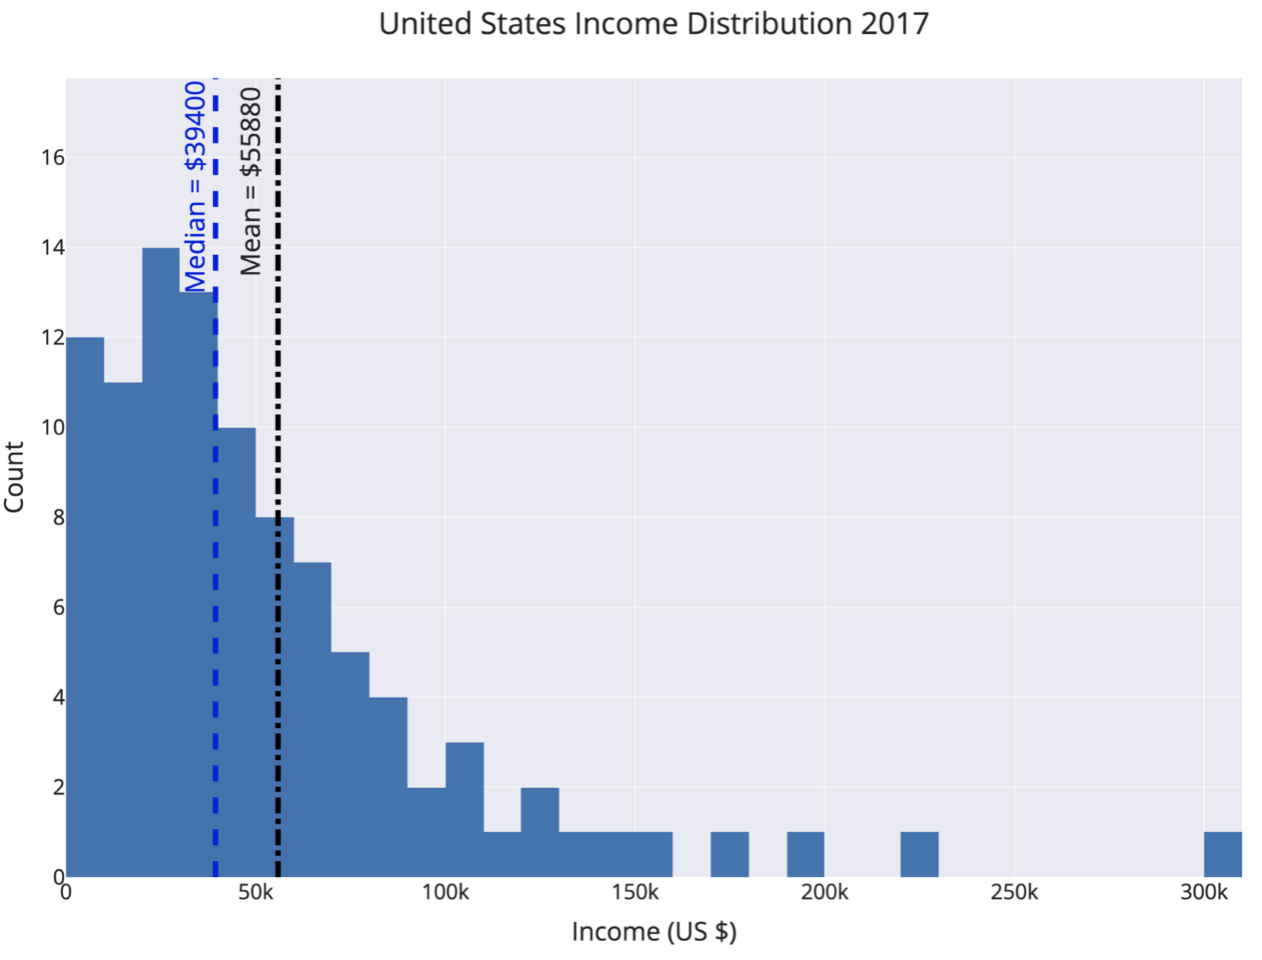
It will be very important to know when “average” is specified, we must clarify if you are talking about the mean or the median because it can make a big difference.
The world is not symmetrically distributed and therefore we should not expect the mean and median of a distribution to be equal.
- Use of comparisons
When looking at a statistic, the important question is often not what the value is, but how the current value compares to the previous value. In other words, what is the relative change compared to the absolute magnitude?
The data is often on scales that we are not familiar with and we need a comparison with other numbers to know if a statistic represents a real change. For example, is the 14,056,000 km2 area of the Arctic Ocean large?

- The use of referents to influence decisions
Huff describes the idea of an “acceptable name” as one that is added to a study to give it an air of authority. Medical professionals (doctors), universities, scientific institutions and large companies have names that lead us to automatically trust the results they produce. However, many times these “experts” did not actually produce the work, but only tangentially participated and the name has been added to influence us.
Even when the results come from a confirmed “expert,” that doesn’t mean you should accept them without hesitation. The argument from authority is a fallacy that occurs when we assume that someone with greater power is more likely to be right. This is false because past success does not influence whether current results are correct.
Conclusions
In short, the book suggests that we keep a skeptical look towards any type of data. Any number represents a distillation of a set of data, which was taken from a sample of a population by error-prone humans, using imperfect tools, under constantly changing conditions at a single point in time.
All of this leads us to two conclusions:
If you put all your faith in a number, then you are over-tuned to the particular circumstances that produced the number.
Statistics and data are never purely objective. A statistic is an interpretation of uncertain data designed to persuade.
